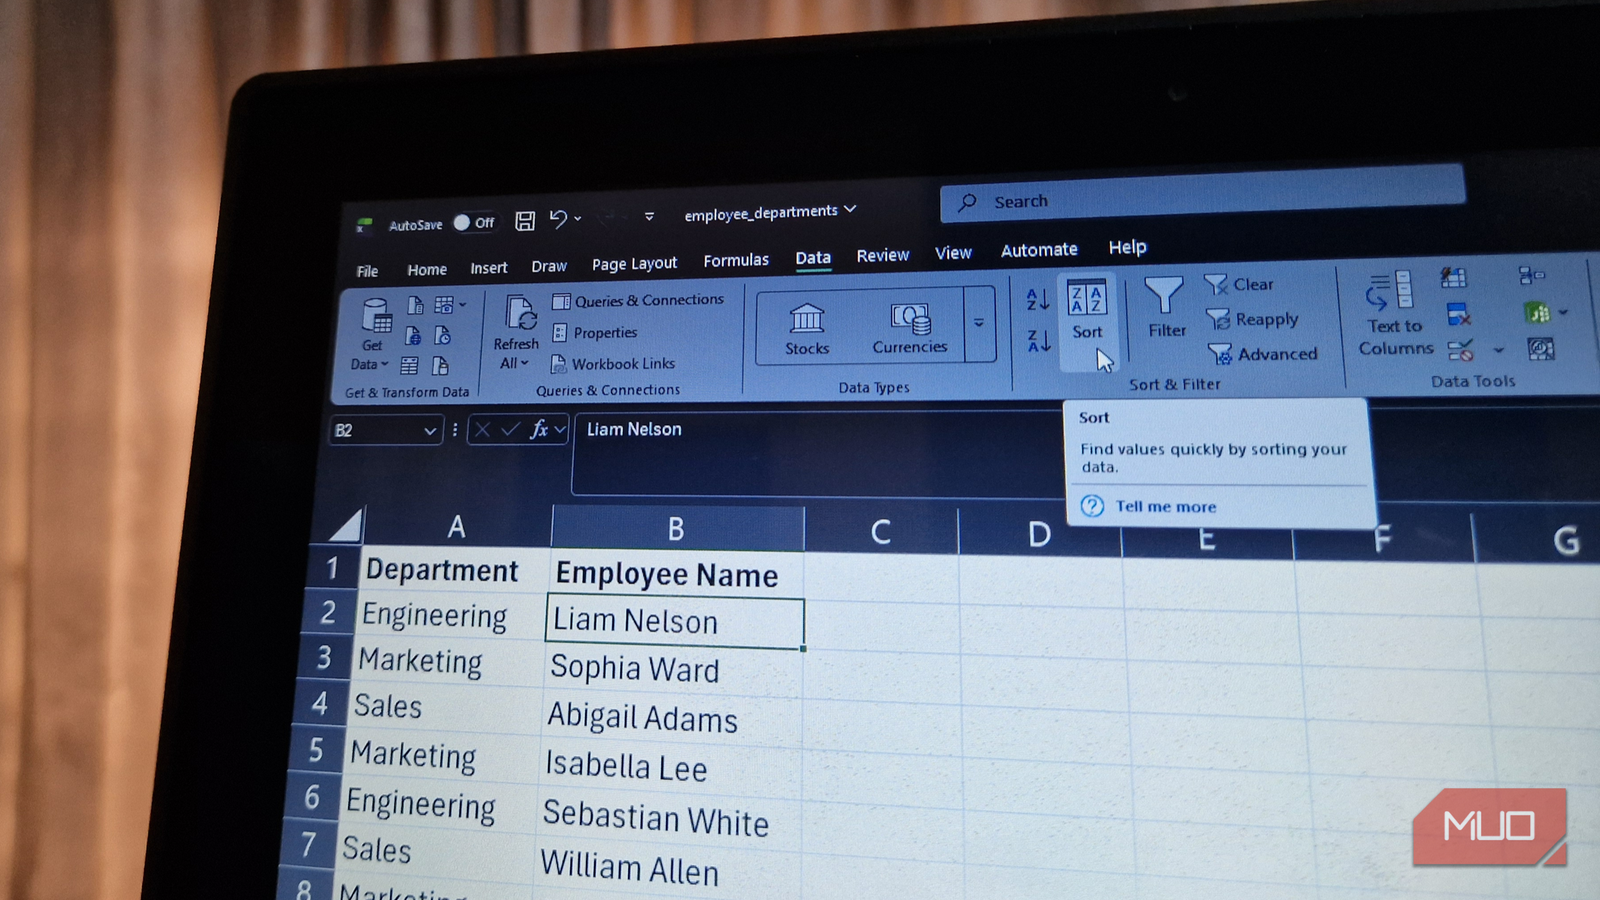
Excel is a wonderful tool right up until it isn’t. The moment your spreadsheet starts holding customer records in one tab and their orders in another, or your row count creeps past a few hundred thousand and suddenly every filter is a chore, you’ve hit the limit of what a grid of cells was ever meant to do.
The good news is that you don’t need a computer science degree or an enterprise IT budget to fix that. If you feel like you’ve outgrown Excel, it’s time to move to a database, and there are tons of options matching the job.
When your tabs are secretly a relational database
Reference columns do what VLOOKUP was pretending to
If your Excel database is multiple tabs held together with VLOOKUP and a dash of hope, what you actually need is a relational database, and Grist is one of the friendliest to start with. It looks and feels like a spreadsheet, but under the hood every Grist document is a real SQLite database. Columns behave like typed database fields rather than freeform cells that can hold a number one day and text on another.
The feature that does the heavy lifting here is the reference column, which lets you link a row in one table to a row in another, the same way a foreign key links tables in a proper relational database. This means an order record can point directly at a customer record instead of duplicating that customer’s details everywhere.
And since Grist is Apache 2.0 licensed and self-hostable via Docker, it fits neatly into a homelab setup, and formulas can be written in actual Python rather than a spreadsheet formula language — a nice change if you’re already comfortable with scripting. Grist is the right choice specifically when the core issue is structure and relationships, not the overall scale of the data.
When Excel just gives up and stops opening
A billion rows, one binary, no cluster required
Excel tops out at about a million rows, but it starts struggling well before that if there are complex formulas in the spreadsheet. DuckDB was built for exactly the opposite situation; it’s an embedded, in-process SQL engine that treats a laptop like a mini analysis machine, using columnar storage and vectorized execution to process data in batches rather than going row to row.
This means that it can run a group-by aggregation on ten million rows in well under a second while pandas is still working and Excel has simply thrown in the towel, and it can query a huge CSV or Parquet file directly without ever fully loading it into memory first. It’s been benchmarked comfortably handling datasets from a few megabytes into the tens or hundreds of gigabytes on a single machine, including real-world cases like billions of taxi trip records.
There’s no server to install or cluster to manage either. It’s a single binary or pip install, and you write plain SQL against it, which makes it the natural choice when dealing with massive datasets. The only problem, however, is that it’s not very user-friendly, but you’ll find plenty of resources online to help you along.
When the problem isn’t structure, it’s the data itself
Clustering catches what find-and-replace never will
The size and structure of your dataset is one thing, but if the data itself is sloppy, that introduces a whole new problem. It could be inconsistent date formats, stray whitespaces, the same name spelled different ways; all of these problems would render traditional data management tools moot, because most of them assume that your data is in perfect order before processing it. OpenRefine, however, doesn’t. It’s a free, open-source tool built specifically for cleaning messy data, transforming it into a consistent shape, and even matching it against external reference databases.
It runs locally in your browser and works rather well with CSV files, spreadsheets, and other tabular imports. The most useful feature you’ll find here is clustering, which identifies similar values and lets you merge them into one standardized form.
For example, OpenRefine can group New York City, NYC, New York, and NY so you can review whether they represent the same thing before normalizing them. Its faceting tools make it easy to isolate unusual values, blanks, outliers, or malformed numbers. Every transformation is recorded, so you can inspect the cleanup process, reverse a mistake, or replay the same steps on the next monthly export.
When the numbers you need are stuck inside a PDF
Stream or Lattice, whichever one untangles your table
PDFs are designed to preserve how a document looks, not to make its data reusable. That’s why copying a table from a report, invoice, filing, or government document often produces a jumbled block of text. Tabula is a free, open-source program that solves exactly this problem.
It’s made to extract tables from text-based PDFs and export them as CSV or Excel files. Load a PDF, let Tabula detect tables or draw a box around the one you need, preview the extracted results, and export the data. The preview step is rather important here as PDF tables can have irregular spacing, multi-line headers, or pages that do not follow a consistent layout.
The program offers Stream and Lattice extraction modes, and switching between them can fix many columns that initially come out misaligned. The catch is that Tabula works with PDFs that contain embedded text. If the PDF is a scanned image, you will need OCR software first. It also extracts tables, not charts or arbitrary visual elements.
When the same report eats your afternoon every month
Build the report once, refresh it forever after
You may have a workable Excel process, but every week or month begins with importing the newest export, cleaning columns, refreshing pivot tables, rebuilding charts, and hoping nothing breaks. Power BI Desktop is designed for that workflow.
You connect it to source files or databases, define transformations in Power Query, create relationships and calculations in a data model, and build the report once. When the next dataset arrives, you simply refresh instead of rebuilding the entire thing. This makes Power BI Desktop incredibly useful for things like recurring sales reports, content metrics, expenses, operations dashboards, and inventory monitoring.
It can also work alongside other tools. You can clean inconsistent reports with OpenRefine, analyze large source files with DuckDB, store linked operational records in Grist, and then use Power BI to present repeatable visual reporting.
Know your bottleneck, then reach for the right tool
Each one solves the specific bottleneck that made Excel buckle in the first place, whether that’s relationships, scale, messiness, format, or repetition.
Knowing which bottleneck you’re actually dealing with is half the battle. Once you’ve got that figured out, you can quickly deploy the right tool for the job and get over that hurdle without worrying about your Excel files crashing again.